27: Visualising graph paths
Surrealist has another neat visual trick: the ability to view graph paths.
Let's see what a visual graph path looks like in the query below that shows what places each person is a customer of.
After running the queries below, click on the button to the left of "Run query" and select the "Graph" view. You'll see the output "Waiting for records to visualise", because Surrealist at this point is showing the output of the first query: a DEFINE INDEX statement. But if you click on "Query 1" and select "Query 2" instead (the graph query), you'll suddenly see a set of 12 person records each pointing to a single place.
When using graph visualisation, you'll actually see all of the links between person and place, not just customer_of and works_at. Instead, on the right-hand side of the embedded window is a place called "Edges" where you can select and deselect which edges to show.

When you hover your mouse arrow over the records, you'll see the record IDs.
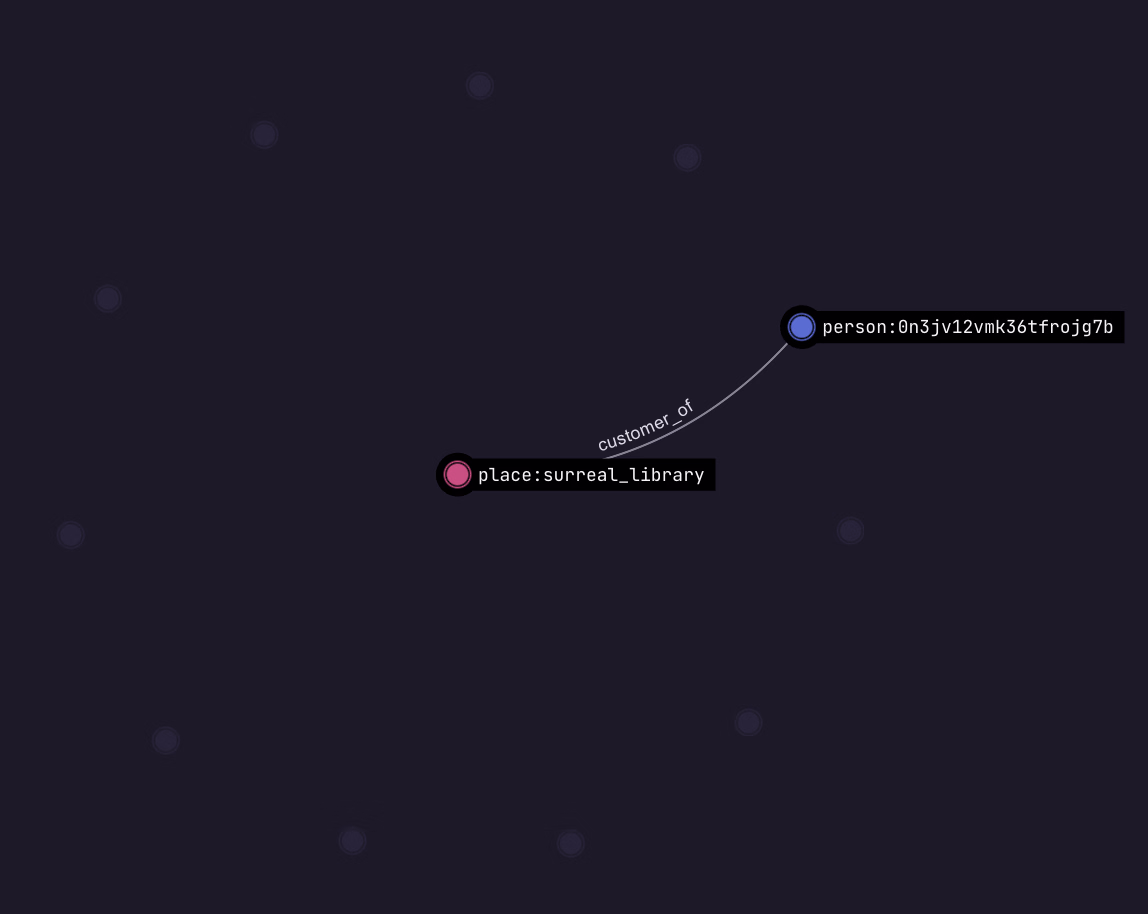
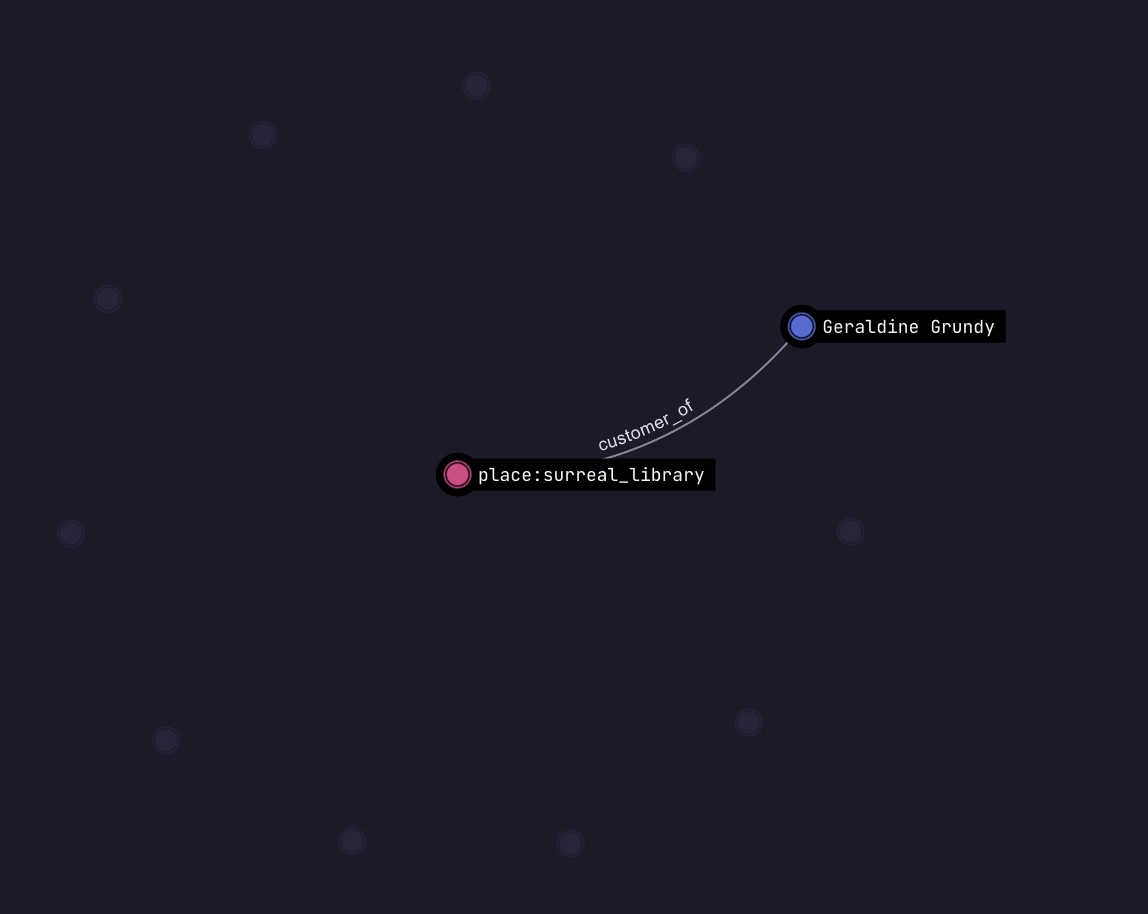
You'll notice that the person record just shows a random ID, so we don't know which person this is. We can change the output by clicking on the tab in the corner called "Configure labels", then "Add label mapping". Click on person, and enter the property name name, and do the same for place. Now you'll see the names of person records when you hover over them instead of just an ID.
There are also a lot of person records that are not part of this particular graph result. You can see them by clicking on the "Stray records" button at the bottom right.