Every instance reports its own resource use and activity, with no agent to install and no scrape target to configure.
The at-a-glance view is the instance Dashboard. The detail is under Metrics & logs in the instance sidebar of SurrealDB Studio.
The instance dashboard
Opening an instance lands on its dashboard, which states what the instance is and what it is currently doing. The header reports the version, region, instance type, and organisation.
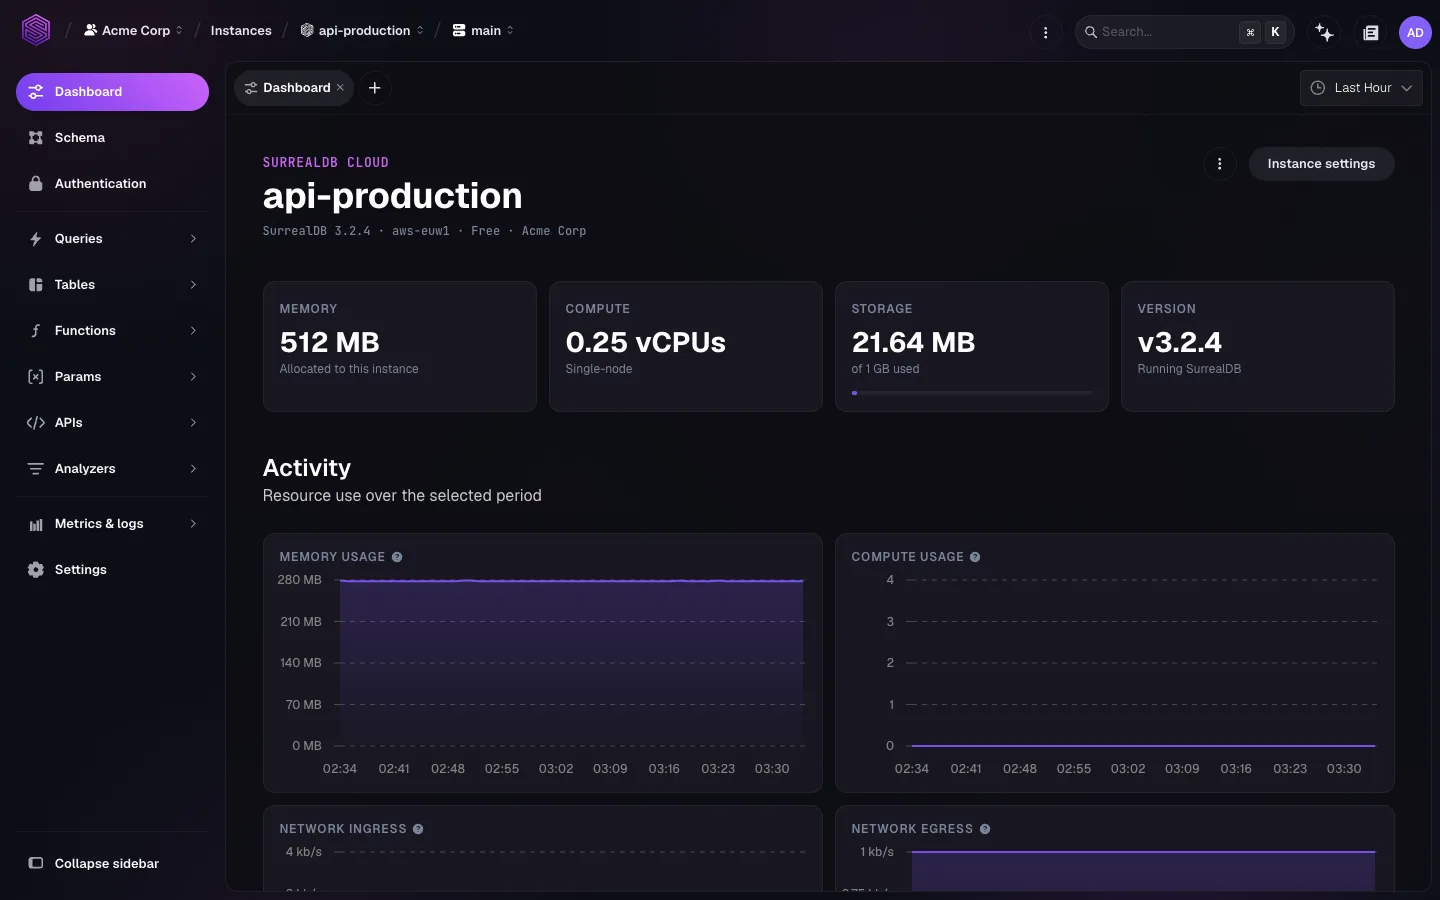
The four cards across the top are the numbers to check first. Storage is the one to watch over time. It shows consumption against the provisioned limit, and a disk that reaches its limit stops accepting writes. See Scaling for raising it.
Below the cards, Activity plots resource use over a period you select. The default is one hour. Longer windows show trends rather than spikes.
Metrics
Metrics & logs groups the signals into three.
| Group | What it reports |
|---|---|
| System | Compute and memory use of the instance |
| Connections | HTTP and RPC request volume |
| Network traffic | Network ingress and egress |
Each group takes a time range: the last hour, twelve hours, day, week, or month. Short ranges show what is happening now. Longer ranges are what you need before you decide to resize, because a resize should answer a trend rather than a single spike.
Read the groups together rather than separately. Rising connection counts with flat compute point at connection handling in the application. Rising compute with flat connections points at the queries themselves.
Logs
The Logs view lists instance activity: startups and shutdowns, imports, version changes, and other lifecycle events. Filters narrow the list by:
Level: the severity of the entry.
Source: the component that emitted it.
Message: free text within the entry.
Log entries stay queryable for a retention period. To keep them longer, ship them to your own log store rather than rely on the console view. That is what compliance requirements and correlation with other systems usually need.
These are activity logs for instance-level events. Audit logs, which record who ran which statement against which resource, are not yet available for instances. The record shape and the pipeline are documented under audit logging for deployments that have them.
What to watch
These signals most often warrant action:
Storage climbing towards the provisioned limit.
Compute or memory sustained near the instance-type ceiling under ordinary traffic.
Connection counts saturating, or clients being refused.
Error-rate spikes in the logs that correlate with a deployment or a schema change.
Sustained pressure on the first three is a scaling signal. A spike that coincides with a change you made is usually a query or schema problem, and a resize hides it rather than fixes it.
From the command line
surreal cloud instance metrics and surreal cloud instance logs print the same data for scripting or for feeding an external monitor. surreal cloud instance watch follows the state of an instance during a change. See surreal cloud instances.
The wider observability surface
This view presents the same telemetry a self-hosted deployment scrapes directly. When you need the full vocabulary, see the Observability section, and the metrics reference in particular. Those pages cover every metric family and label, the environment variables that control them, the audit-log record shape, and the slow-query pipeline.