Observability
SurrealDB can be monitored by enabling built-in observability.
Enable observability
To enable observability, the SURREAL_TELEMETRY_PROVIDER environment variable has to be set to otlp. If set to anything else, no observability will be available.
If enabled, SurrealDB will send metrics and/or traces to an OpenTelemetry Collector. Configuration of the collector is done via environment variables. The most important one is OTEL_EXPORTER_OTLP_ENDPOINT. By default this is set to localhost. It should be set to the GRPC endpoint of your OTEL collector. For example if your OTEL collector named my-collector is running in Kubernetes in the monitoring namespace the following can be used:
Metrics can be disabled (even if SURREAL_TELEMETRY_PROVIDER is set to otlp) by setting the SURREAL_TELEMETRY_DISABLE_METRICS environment variable to true. Similarly traces can be disabled by setting SURREAL_TELEMETRY_DISABLE_TRACING to true.
Metrics
Metrics are gathered every minute and sent to the collector. The following metrics are present:
| Name | Instrument | Explanation |
|---|---|---|
| rpc.server.duration | histogram | Measures duration of inbound RPC requests in milliseconds |
| rpc.server.active_connections | counter | The number of active WebSocket connections |
| rpc.server.response.size | histogram | Measures the size of HTTP response messages |
| http.server.duration | histogram | The HTTP server duration in milliseconds |
| http.server.active_requests | counter | The number of active HTTP requests |
| http.server.request.size | histogram | Measures the size of HTTP request messages |
| http.server.response.size | histogram | Measures the size of HTTP response messages |
The metrics are shown here in the form required by the OpenTelemetry Metrics Semantic Conventions with a . separator. When ingested into Prometheus the . separator will be replaced with an _. For example rpc.server.active.connections will be transformed into rpc_server_active_connections.
Tokio console
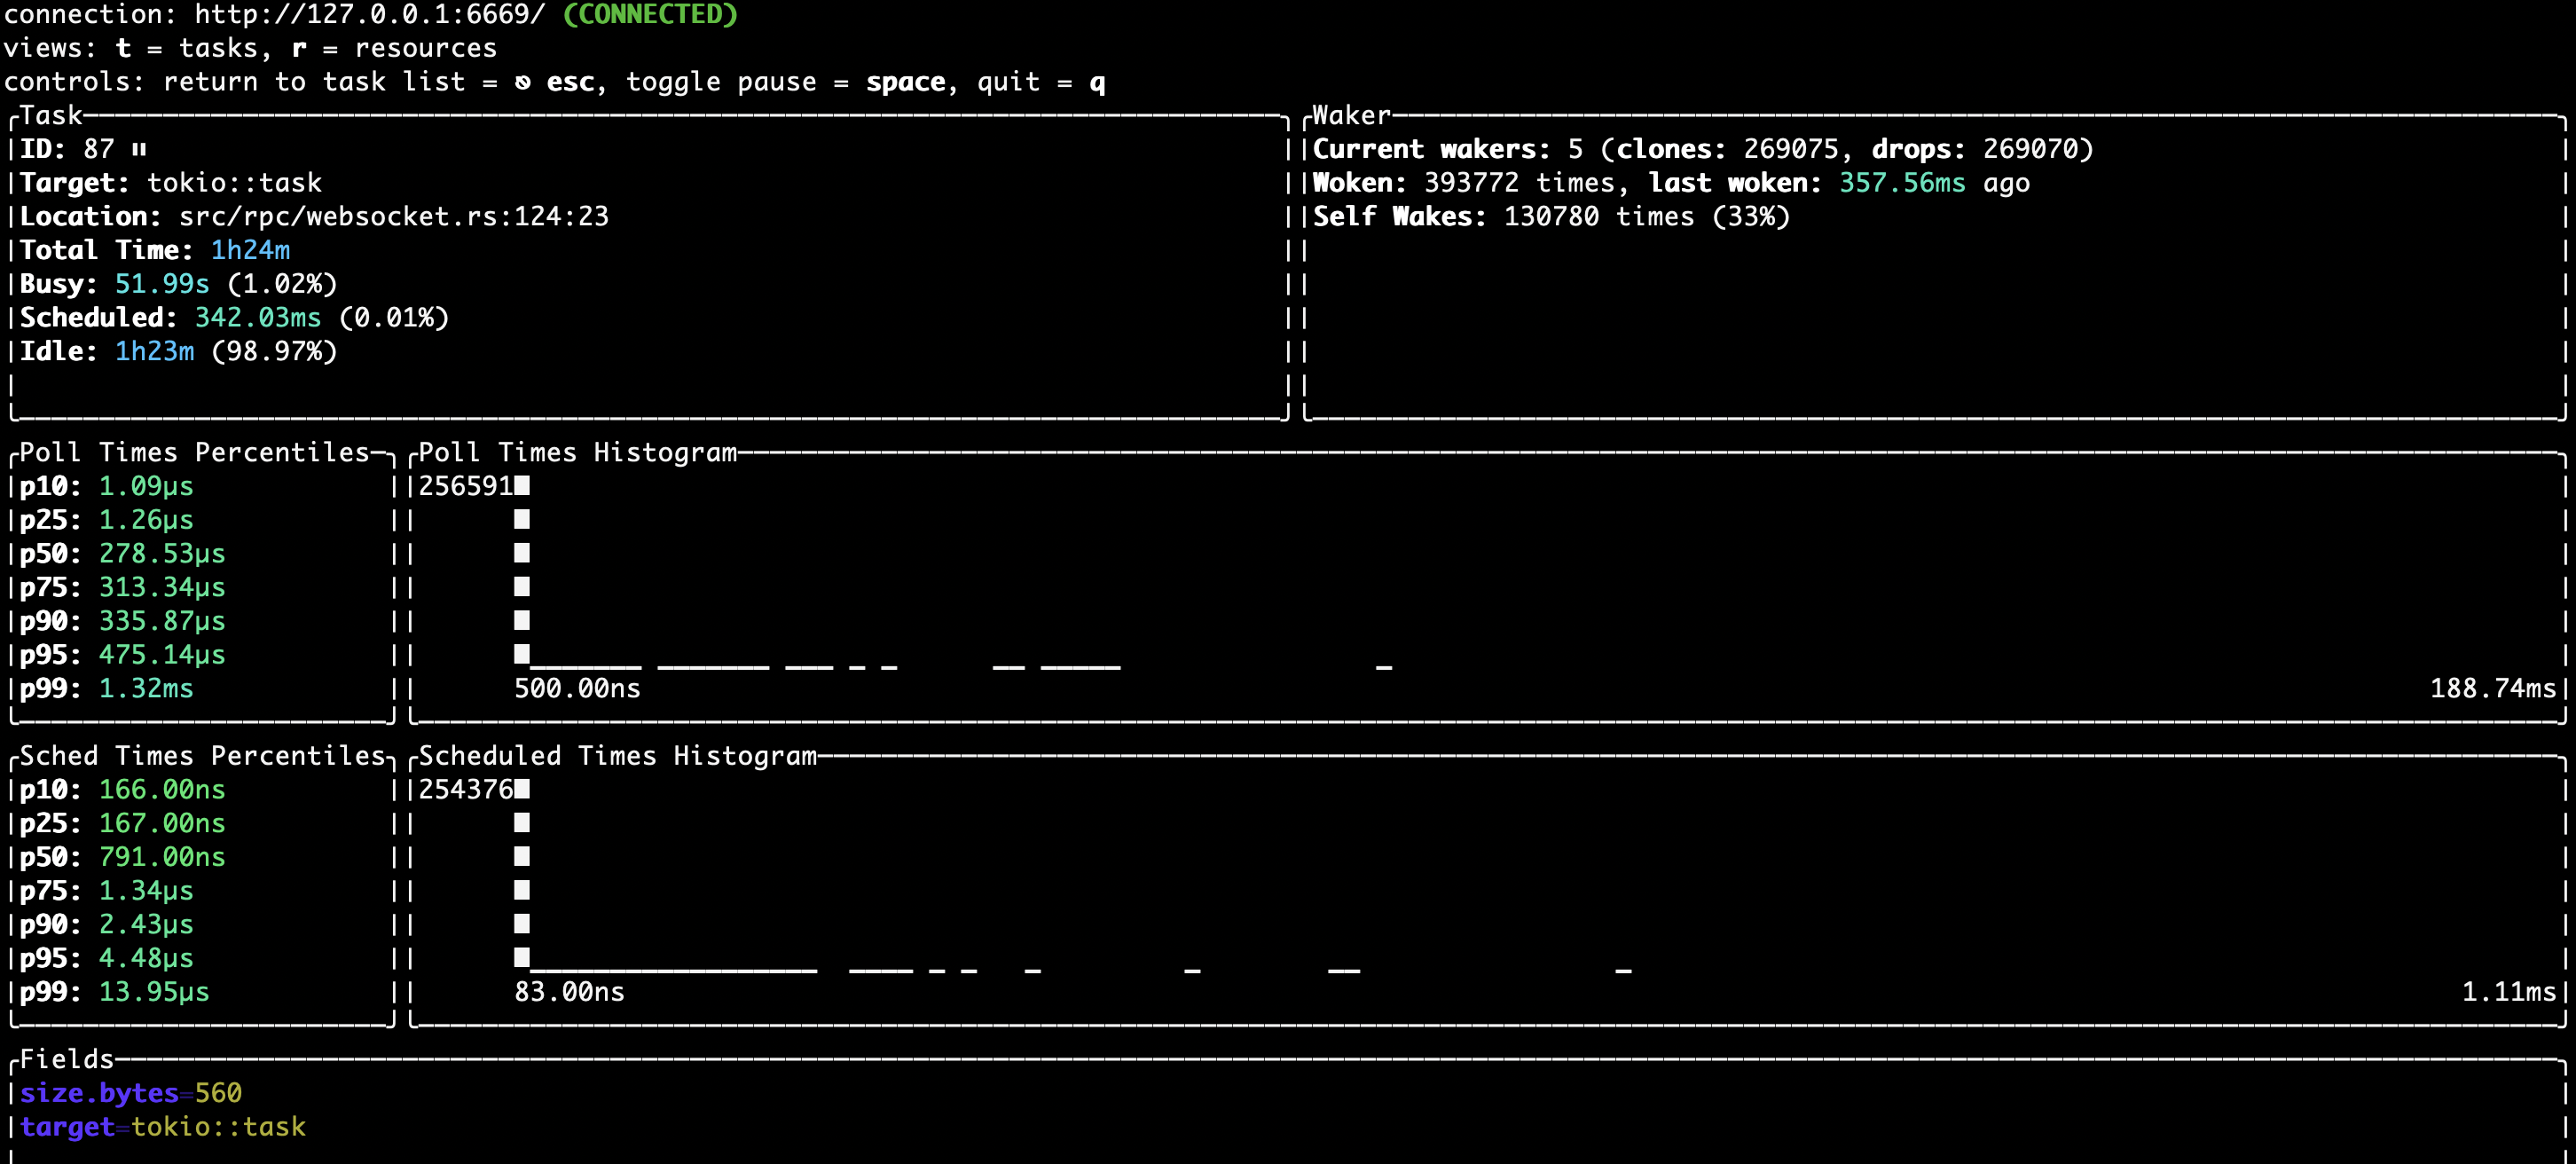
The tokio console tool can also be used to observe the low-level async tasks for the database.
To use it, install the Cargo package manager for Rust, use the command cargo install --locked tokio-console to install tokio console, and then tokio-console to run it.


The following environment variables are used to manage the console:
SURREAL_TOKIO_CONSOLE_ENABLEDset totrueto enable the consoleSURREAL_TOKIO_CONSOLE_SOCKET_ADDRto override the default address at127.0.0.1:6669SURREAL_TOKIO_CONSOLE_RETENTIONto override the default6s(six seconds) value for length of time to retain data for completed events.
Log output settings
SurrealDB contains a large number of flags for the surreal start command and environment variables to modify the output from the database server. A quick overview of some of these flags is as follows:
Use
--logto set the logging level (info,warn,trace, etc.).Use
--log-formatto set the format (textorjson).Use
--log-socketto send logs to a certain host:port.Use
--log-file-enabledto output logs to a file, followed by--log-file-pathto specify the path to save logs to to.Use
--log-file-rotationto specify whether to create a new file for logs at a certain interval (daily,hourly, ornever).Use
--slow-log-thresholdto specify a duration after which a query will be logged as a slow query.Use
--slow-log-param-allowand--slow-log-param-denyto indicate which parameters are to be calculated before logging. For example, if$table_namehas the value "person", allowingtable_namewill changeSELECT * FROM $table_nametoSELECT * FROM personin the logs.