Metrics
In this section you will explore the different metrics that are available for your SurrealDB Cloud Instance. The following metrics are available for your SurrealDB Cloud Instance:
- System: this includes the compute and memory usage of your SurrealDB Cloud Instance.
- Connections: this includes HTTP and RPC requests to your SurrealDB Cloud Instance.
- Network traffic: this includes the network egress and ingress traffic to and from your SurrealDB Cloud Instance.
To access the metrics of your SurrealDB Cloud Instance, navigate to the monitoring tab in the sidebar. Under the metrics option, you will see a list of metrics for your SurrealDB Cloud Instance.
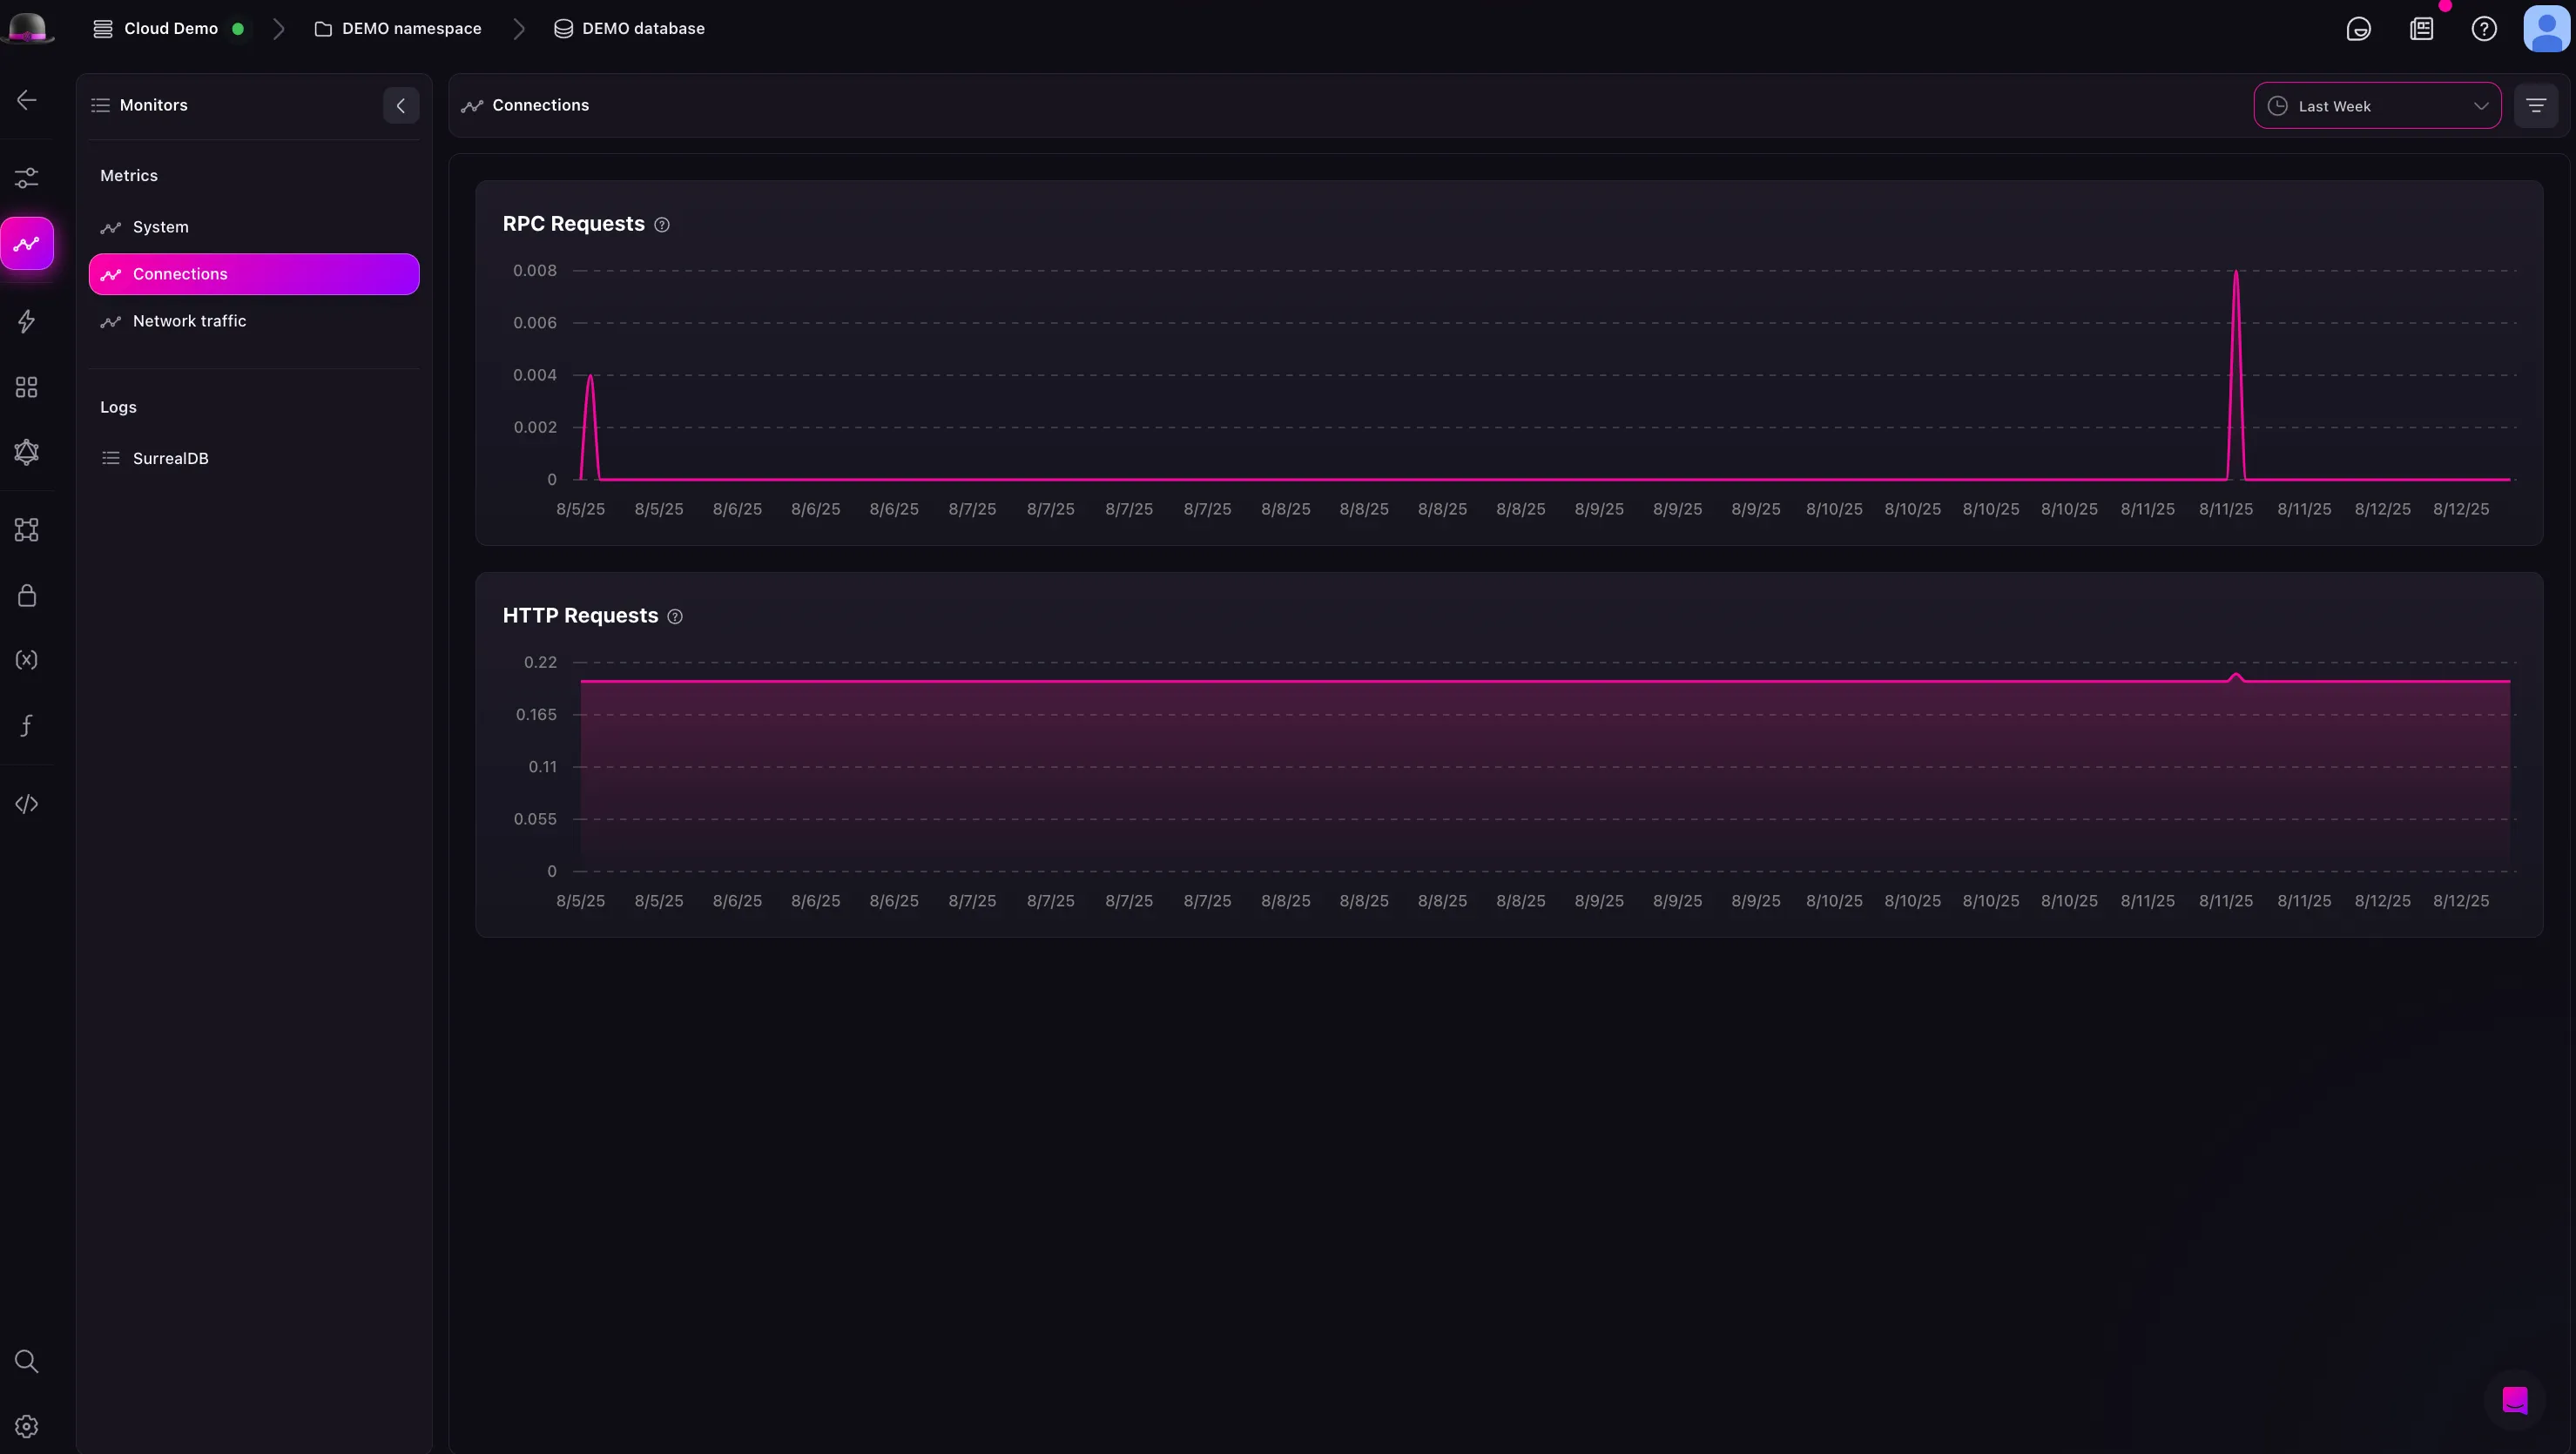
You will see a list of metrics for your SurrealDB Cloud Instance.
Filtering metrics
While viewing the metrics of your SurrealDB Cloud Instance, you can filter the metrics by selecting the filter button. This will open a modal where you can select the metrics you want to view. You can filter by the last hour, last 12 hours, last day, last week, and last month.